ETFs built for the
next generation
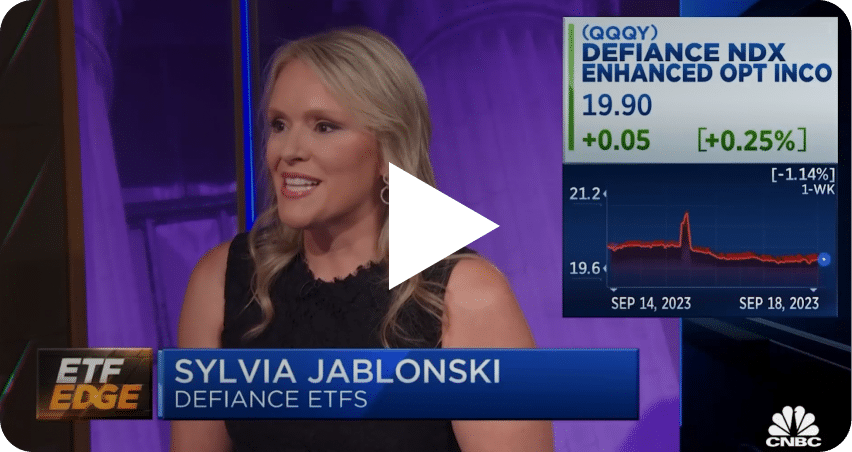
As Seen In
Leading the wave of thematic & income investing
Founded in 2018, Defiance stands as a leading ETF sponsor dedicated to income and thematic investing. Our actively managed options ETFs are designed to enhance income while our suite of first-mover thematic ETFs empower investors to express targeted views on dynamic sectors leading the way in disruptive innovations, including artificial intelligence, machine learning, quantum computing, 5G, and hydrogen energy.
Our ETFs More Details
SPYT
Defiance S&P 500 Income Target ETF
TRES
Treasury Alternative Yield ETF
IWMY
R2000 Enhanced Options Income ETF
JEPY
S&P 500 Enhanced Options Income ETF
QQQY
Nasdaq 100 Enhanced Options Income ETF
HDRO
Hydrogen ETF
CRUZ
Cruises, Hotels & Airlines ETF
QTUM
Defiance Quantum ETF
FIVG
5G ETF